
AI will read the text and can understand the content but will need help with:
- disambiguation; and
- understanding context and meaning.
This is when keywords are vital – though not just keywords. We additionally need to include a definition (for example, we would need to distinguish between the different meaning of “bright” to avoid any confusion; the system needs to know whether the content relates to intelligence or light). After all, AI only works with the information we provide and including both the keyword plus definition will ensure that there are no ambiguities (this not only applies to words but also acronyms). This is one of the reasons that a knowledge graph is not static; it is a dynamic environment. We need to ensure keywords are kept up-to-date as language evolves.
To help with disambiguation, co-reference resolution is used to find expressions in a given text that refer to the same real-world entity. Embeddings are also used to help the machine understand the meaning of a word by placing semantically similar inputs close together in the embedding space. The more content you have, the more accurate the similarity. For instance, a search for “artificial intelligence” would also retrieve data including variations like “AI” or related terms like “machine learning” or “model based reasoning.” With the help of machine learning techniques, the data conversion pipeline keeps on improving as more data are added.
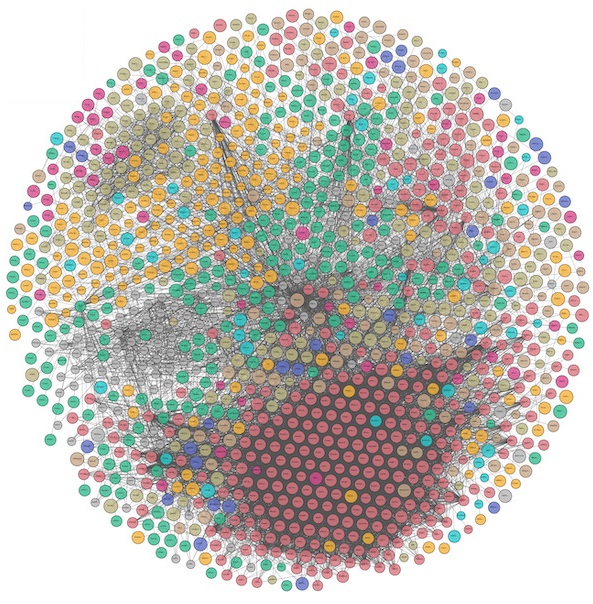
All of this will maximize the exposure of content to a wider audience as searches become more tailored, with similarities between concepts becoming self-evident. Topics that are semantically close will be centered in the same zone on the knowledge graph and connections can be visualized. You can take a look at a mammoth knowledge graph of linked open data and explore it yourself at the “The Linked Open Data Cloud” site here, which is also featured in a Data Science article by Xander Wilcke et al. from 2017 [3]. The depiction of the LOD cloud is shown in the visual below, with 1,260 datasets with 16,187 links (as of May 2020). Each vertex represents a separate dataset in the form of a knowledge graph.
Explore our own knowledge graph with LD Connect
You can also access another working example of a knowledge graph, i.e., our own IOS Press knowledge graph, via our linked data platform LD Connect – the new and improved version of which was released at the end of 2020. This platform is being improved in a multi-phased way, with new tools being continuously developed behind the scenes (our similarity finders are in proof-of-concept in the current site and feedback is welcome!). You can read about the earlier beta version 2 launch here. Our linked datasets include, for example, metadata of journal articles and book chapters, authors, affiliations, countries, volumes, issues, series, pre-press and publication dates, (e)ISSNs, DOIs, link to full text, accessibility, keywords, pages, and abstracts – and our embeddings are based on all full text.
Pascal Hitzler, PhD, Kansas State University and co-Editor-in-Chief of Semantic Web, is enthusiastic about these developments and the fact our unsiloed data is available in this way. He comments: “Thank you for providing this data for the scientific community! Publication metadata provided as knowledge graphs using established standards – as done in LD Connect – makes it much easier for any interested party to ingest and reuse this data, combine it with other data, etc. This enables easier development of applications, such as literature search, topic tracing, reviewer finding, co-authorship network analysis, and more. I hope that other scholarly publishing houses will follow your lead.”
Our linked data platform LD Connect has recently been rebranded and rebuilt from scratch to make it more informative and visually appealing. You can check out the newly-designed site here and, as always, we welcome your feedback. Sign up to be kept updated with LD Connect news here!
References
1. “Challenges of Knowledge Graphs” by Sebastien Dery (1 December 2016), link: medium.com/@sderymail/challenges-of-knowledge-graph-part-1-d9ffe9e35214 (last accessed: 22 February 2021).
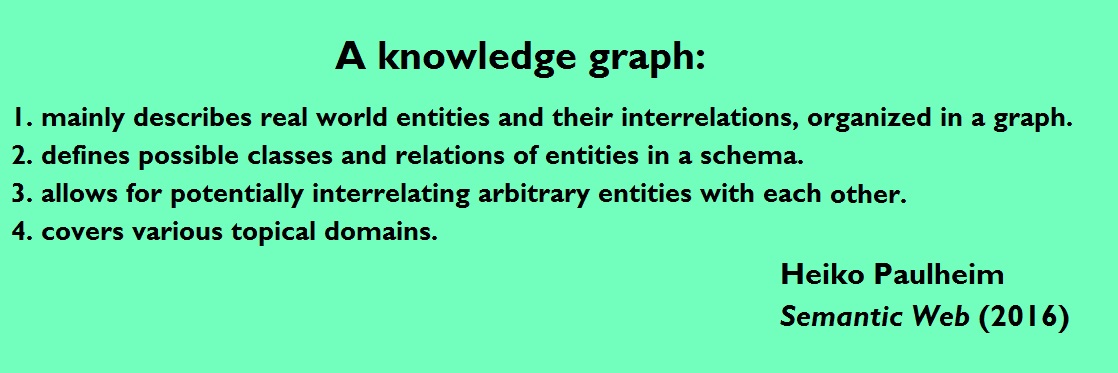
2. “Knowledge graph refinement: A survey of approaches and evaluation methods” by Heiko Paulheim, Semantic Web, Volume 8, Issue 3, pp. 489–508 (2016), link: content.iospress.com/articles/semantic-web/sw218 (last accessed: 22 February 2021).
3. “The knowledge graph as the default data model for learning on heterogeneous knowledge” by Xander Wilcke, Peter Bloem, and Victor de Boer, Data Science, Volume 1, Issue 1/2, pp. 39–57 (2017), link: content.iospress.com/articles/data-science/ds007 (last accessed: 22 February 2021).
Further Background Information
- Knowledge Graphs for eXplainable Artificial Intelligence: Foundations, Applications and Challenges, Eds. Ilaria Tiddi, Freddy Lécué, and Pascal Hitzler, Volume 47 of Studies on the Semantic Web (Amsterdam: IOS Press, 2020), link: iospress.com/knowledge-graphs-for-explainable-artificial-intelligence-foundations-applications-and-challenges (last accessed: 22 February 2021).
- “Knowledge Graphs: Increasing Content Discoverability” by Ruth Pickering (Yewno), ConTech Live Webinar (2020), link: contechlive.com/ruth-pickering (last accessed: 22 February 2021).
- For insights into how the LD Connect embeddings and Toolbox were developed by the team read: Gengchen Mai, Krzysztof Janowicz, and Bo Yan, “Combining Text Embedding and Knowledge Graph Embedding Techniques for Academic Search Engines,” in Proceedings of SemDeep-4 Workshop co-located with ISWC 2018, Oct. 8–12, 2018, Monterey, CA, USA; link: ceur-ws.org/Vol-2241 (last accessed: 22 February 2021).